Featured Senior Athlete: Bob Scott
I have many role models. They are people I look up to for a several reasons. They’re inspirational. All have similar characteristics including friendliness, positivity, happiness, humility, honesty, and more. In fact, I tend to avoid people who don’t have these qualities to at least some extent. I’m always looking for role models with these characteristics because I often fail to live up to my own high standards. I’m human, I guess. Unfortunately, such inspiring people are also few and far between. Those who meet these high ideals also often fit into a subcategory in groupings such as business, intellect, family, leadership, and more.
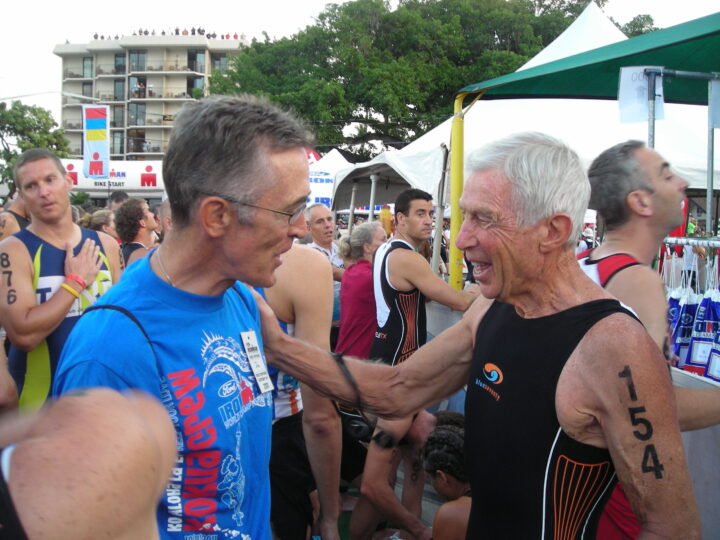
In the category of dedication to health and fitness, the winner, hands down, is Bob Scott (picture below). I’ve known Bob for more than 20 years and I have nothing but good things to say about him. He certainly has all the qualities above, and more. I’ve never seen him even come close to violating the qualities I look for in people. He’s one of the friendliest, most positive, happiest, etc people I’ve ever known. Besides being a just nice guy, what really sets him apart for me is his dedication to health and fitness. He’s unmatched.

Joe Friel (L) and Bob Scott (R) at Ironman World Championship when Bob was 81.
We met through a mutual friend in Kona, Hawaii at the Ironman World Championship in the late 1990s. Bob was in his 60s then. In Kona and the many other triathlons and running races he has done over the course of the last 50-some years, he has always been a contender for the podium, and usually winds up there in his age category. He has set age group records for so many years that he’s lost track of them. The one that always stands out for me was in 2005 when he finished Ironman Hawaii in 13:27:50. Late on that day many years ago, he saw me on the side of the road during the run and stopped to chat, even though he was obviously on his way to a course record in the 75-79 age group (he was 75 at the time). Would I have done that? I have my doubts. That’s what I mean – great guy. (His fastest time in Kona in 15 races was 12:58 at age 71.)
Over more than five decades of training for endurance sport I’ve never heard him say, “enough.” He seems to be always looking forward to the next workout. Now at age 92, even though retired from racing, he still works out daily. He starts the day around 5 A.M. with an indoor bike trainer ride. This often includes intervals. Then he heads to his home gym for weightlifting or a treadmill run or a session on the rowing machine. After that he finishes up with pushups and stretching. The Chicago-area winter makes outdoor training difficult for him now. He admits that in his younger days the weather would not have stopped him from going out on the roads. “I used to just get out there and do my thing,” he says. But not anymore. This may be the only significant change that has occurred in his more than 50 years of training.
In 2005 or 2006 Bob had a cardiovascular stent installed after he realized his chest didn’t feel right during a ride (Bob isn’t sure of the date as “it wasn’t that big a deal.”) He rode over to see his doctor who told him to get to the hospital right away. Bob wanted to ride his bike over. The doctor nixed that and got an ambulance. He was also told not to do Ironman Hawaii that year as it was too risky. I saw him in Kona the day before that race and he told me that he should have raced as he felt fine.
Due to his racing knowledge, wisdom, and experience he has been sought out by many to coach him. Coaching became his second profession, which he still does in his 90s.
As a young mechanical engineer with GM and Cummins Diesel Engine, Bob took up running, especially marathons. His favorite was Boston. At that time he was running 90 miles per week. He says he tried doing more miles but found it just didn’t work for him. His best time in Boston was a 3:02 when he was 39. After 19 Boston Marathons and retirement as an engineer he decided to give triathlon a try. He proved to be one of the best in the senior race categories. Along the way he set three age group records in the Hawaii Ironman. Now he’s retired from triathlon, also. “As a retired competitive runner and triathlete of 92, my happy days are over for competition,” Bob told me recently. “Age and the pandemic that shut down gyms and swimming pools closed off my competitive days also – but not my spirit.”
Indeed. At age 92 he is still an exceptional athlete – and, more importantly, an exceptional person who I strive to emulate.
Part 8. Why Do We Slow Down With Age?
Are you showing signs of getting slower? Most senior athletes in their 60s and 70s realize they aren’t as fast as they were just a few years ago. It certainly came to my attention recently when my Sunday morning ride group was waiting (and waiting…) for me at the tops of hills. I was 78 then. That had never happened before, at least not with that much waiting. I grudgingly decided it was best if I quit riding with them. After riding shoulder to shoulder with athletes much younger than me for more than 40 years, the waits were now becoming too embarrassing. Such is life as we age up.
At some point in the seventh or eighth decade of life each of us experiences something like this. We just can’t keep up with the youngsters – those in their 40s and 50s – anymore. It’s to be expected.
If you are still serious about training and performance, I’m sure you wonder from time to time – what’s going on? Why am I slowing down? Welcome to the club! By the time we’re in our 60s most of us have become sensitive to this decline in performance. By our 70s it’s common knowledge to everyone that we’re going significantly slower. What’s causing this and what, if anything, can we do about it?
Let’s start with why? In the big picture, from a physiological point of view, it probably begins with your aerobic capacity, more commonly known in the endurance sports world as VO2max. If you suspect a loss of endurance speed this is the most common bogeyman. Following are a few things we know about aging and VO2max. And, a bit later, I’ll touch on what you can do to slow or perhaps even reverse the decline – at least temporarily.
In most athletes, sometime around their 35th birthdays, VO2max begins to go south. Oh, it’s not significant at first. In fact, because you’ve also gotten wiser about training and racing, you may be able to hold off the apparent decline for a few more years. Exactly when this change becomes obvious varies, but it’s inevitable. It’s only a matter of when, not if, you’re going to get dropped by your Sunday-morning group as I did. Of course, you can still hang in there for a few more decades with consistently good training. It’s certainly something that is becoming increasingly evident to you when riding with those darned 20-somethings.
Unfortunately, there isn’t a lot of research on this loss of VO2max for those of us who are truly old fogies. But there are a few studies that may give us a better overview on aging and VO2max. Let’s look at what scientists have reported in research about aerobic fitness and aging.
Aging and VO2max: An Overview
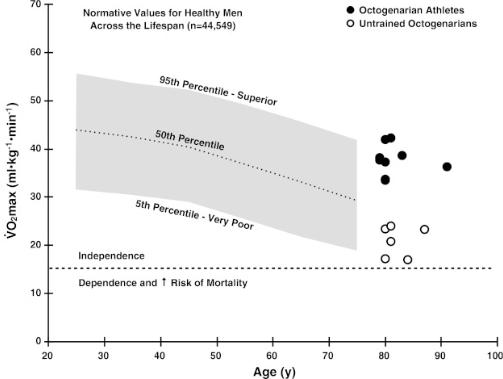
The graph below from a 2013 study provides some insight on what happens to VO2max as we age up into our 80s.1 I know you aren’t there yet, but if you want to still be kicking butt in that age group you need to be kicking butt now. Those in their 80s are telling us what to expect. Let’s listen.
The grey shaded area of the graph below shows the commonly steady decline of VO2max as we move from our mid-20s to our 70s. This is based on studies involving 44,549 subjects. The upper part of that grey area – “95th Percentile – Superior” – represents what you may expect to happen to VO2max if you were very active and fit as an endurance athlete most of your life. Notice on the left end of the grey stripe that the highest VO2max for a 25-year-old in this 95th percentile is about 55 (milliliters of oxygen per kilogram of body weight per minute). The athletes at this age who were blessed with the right parents and opportunities, and who continued to train and race throughout their lives (above the 95th percentile), certainly have much higher aerobic capacities with VO2max numbers in the 60s, 70s, and even higher for a few (Y axis). These are the folks who have been winning for years in your races. Perhaps you also fall into this group. Good choice of parents!
People in the “50th Percentile” in the middle of the grey section are represented by the downward curving dotted line with a VO2max starting point at age of 25 around 45 (Y axis). And the poor souls who make up the lowest range – “5th Percentile – Very Poor” – were in the low 30s in their 20s, probably mostly due to heredity compounded, perhaps, by a rather inactive lifestyle and possibly other health conditions.

That grey segment shows what to expect as you age based largely on where you started at a younger age – and how you trained over those athletic years. On the right side of the chart the black and white dots are the VO2max test results for 16 male subjects in their 80s. The black dots are for 10 lifelong endurance athletes who were tested for comparison with 6 healthy but untrained men – the white dots. The black dots are clearly well above the “50th Percentile” floating at or around the “superior” rating. The white dots are obviously below the 50th with two even flirting with “Very Poor.” We don’t know where any of the 16 started as far as VO2max is concerned, but we know where they were in 2013 when tested.
Before we leave this chart let’s look at one more thing. A frightful one. Notice the horizontal dotted line from left to right across the lower portion starting at about 15 on the Y axis. That’s a key indicator of what can happen if VO2max is quite low. This line represents the threshold for dependence on others for assistance in life. That usually implies such things as wheelchairs, nursing homes, and the threat of impending death. Note that if we continue the slope of the grey bar for the white dots that most will cross the dotted line before the age of 90, with a couple, perhaps, still in their 80s. On the other hand, those represented by the black dots will apparently be well into their 100s before crossing the scary dotted line if nothing changes in their lifestyles. This implies something to us: If you want to be independent, healthy, and still kicking for a long time, don’t stop training.
Another Look At the VO2max Decline
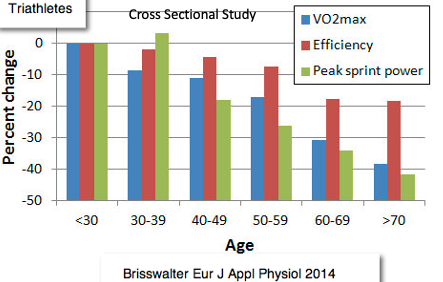
Let’s go back to the idea mentioned above of slowing or even reversing the decline in VO2max with aging. The previous chart suggested that a drop in aerobic capacity can be expected as we get older. I don’t doubt it. But there were only 16 subjects in that study and only 10 who were endurance athletes. We need more athletic subjects to learn about that decline. How great may the decline be for athletes from their 20s to 70s? The chart below gives us some idea of what to expect as far as loss of VO2max with age for endurance athletes. This study looked at 60 triathletes ranging in age from those in their 20s to those in their 70s.2 Each age group had 10 “well-trained” athletes. While the study measured VO2max, efficiency (how much energy was expended at a given intensity), and peak sprint power, let’s look only at VO2max data – the blue bars.
First, notice that the blue bars get shorter as we age up just as we could expect to happen based on the above study. In their 30s the tested athletes were about 10% below those triathletes tested in their 20s. And the blue VO2max bars continue to drop steadily until 60-69 when there is a bit greater decline. (It’s interesting to note here that “Efficiency” did not drop as rapidly as either “VO2max” or “Peak sprint power.” That may be because efficiency is largely a result of skills which usually benefit from saddle time. And a few decades of pedaling a bike pays off with solid skills and therefore fairly steady efficiency.)

But there are some problems with this study, too. There were only 10 athletes in each age group. Did those 10 truly represent what we could expect from a larger contingent of subjects? How do we know if those 60 were truly representative of the athletes in given age groups? And what exactly does it mean when the study says those 60 were “well-trained”? Were they equally well trained relative to what we could expect from a larger group of subjects – like the ones you train and race with, perhaps? These are the problems you run into with “cross sectional” studies. From a researcher’s point of view, such work provides relatively quick answers to questions. The alternative – “longitudinal” studies – follow a given group of subjects for a long time, as in years or even decades, to see what happens with, in this case, aging. These studies are the gold standard but obviously take a long time to produce answers. They are rather rare. Let’s take a look at one such study on aging and performance.
A 22-Year Longitudinal Study of VO2max
This one is rather old. It started more than 50 years ago. But that’s the sort of thing we can expect with these rare longitudinal studies.
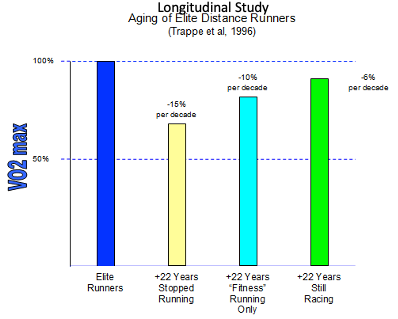
In the late 1960s and early 1970s, 53 male subjects of varying levels of fitness were tested for VO2max at Ball State University in Indiana.3 Ten of them were national class runners in those initial tests about five decades ago. Some twenty-two years later (1996) these same 10 national-class runners were tested again. The following graph shows the results of those VO2max tests. Let’s take a bit deeper dive into the results.

About two decades after their original VO2max tests the same 10 runners came back into the lab to be tested again. As we would expect from what we saw in the two previous studies, their aerobic capacities declined – some more than others. Why the difference?
The 1996 test results divided the runners into three groups based on their training. The first group, represented by the yellow bar, had stopped running shortly after the original test. Over the course of 22 years, they had lost about 15% of their VO2max per decade. In other words, the loss totaled about 30%. They probably started, in their early running careers, with a VO2max in the neighborhood of 70. If correct, at the time of the second testing, it was about 50. That’s pretty good for someone probably in their late 40s to early 50s (see first graph with the grey stripe above).
The second group – the light blue bar on the graph – was a group of the former national class runners who had stopped racing but were still running, albeit “fitness running only” which we can define as mostly long, slow distance. They had lost VO2max at the rate of about 10% per decade for a total of about 20% loss over two decades. By 1996 they had aerobic capacities around 55. Not too bad.
That brings us to the green bar – those runners who were still training and racing 22 years after their first tests. Their VO2max decline averaged 6% per decade, or about a 12% loss overall. That would put their aerobic capacities around 62 by the second test – above the “Superior” designation in the first graph above. That’s quite good for a 40-50-year-old male.
What Does This Mean for You?
What is the take-home lesson here?
The first and most important is that you need to continue training for your sport as you age – don’t stop (see the Bob Scott story above for an example of a 92-year-old who is still at it). And the reasons aren’t only about your VO2max – that’s just a small part of it. In previous posts in this series, I’ve pointed out that frequent and vigorous exercise (including weightlifting) also has a lot to do with your muscle mass and bone density (with some exceptions for the latter according to sport such as cycling). There is considerable other research (which I won’t get into here) revealing that being physically active also has a lot to do with not only physical health, but also mental health and longevity. Does exercise guarantee that you will live a long and healthy life? Not at all (for example, read the illuminating story of Jim Fixx here). But it certainly improves your chances.
Another take-home is that you can probably reverse the loss of VO2max – temporarily – with occasional high intensity workouts (see here for a brief story about a 105-year-old cyclist who improved his VO2max by 15%). I’ve suggested in a previous part of this seriesthat what I call “5-2” training allows you to do that yet still recover nicely. The key here is to not get carried away with high intensity training. Just because a little is good doesn’t mean that a lot is great. That training method calls for avoiding moderate (zone 3) training intensity. High volume, easy training (conversational effort) will also do a lot to boost your VO2max. And you can do a more of that than you can high-intensity workouts such as intervals. The two days of high intensity stuff puts a cherry on the cupcake. That’s what 5-2 is all about – 5 days of easy training and 2 days of higher intensity done weekly.
References (for those who enjoy reading abstracts on PubMed)

You must be logged in to post a comment.