I tend to make things more complicated than they need to be. You probably know that if you’ve read any of my books. That point was driven home to me this week when I reached out to Andy Kirkland, PhD a lecturer at the University of Stirling in Scotland (MSc Sport Performance Coaching). I’ll explain why.
I’m just starting research for my 18th book (someday I’ll tell you why this is so weird for me given my grades in school). For that book I have been working on a chart to “simplify” one of the most complex areas of training for sport – workout intensity. It can be hard to nail down for any number of reasons. When an athlete tells you how difficult a workout was, they are likely to use a word, description, or even a number that they’re accustomed to but which others may not understand (for example, what exactly is “zone 2”?). It could be based on heart rate, power, speed, pace, lactate, TSS, time to exhaustion, or something else. Not only are there several tools used to gauge intensity, but there are also different systems for expressing the intensity experienced during a session. It hasn’t always been that way and the confusion is only getting worse. Hence my attempt to simplify.
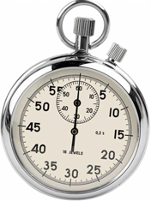
From the late 1950s through the early 1970s I was a runner. In those days only the coach had the only and most basic of intensity-measuring tools – a stopwatch. There were no wristwatches with a timer built-in back then. If the coach wasn’t there with his (all coaches were men back then) stopwatch, that was about the size of an Olympic medal, then all we as athletes had available to us were a few words to describe how difficult the workout was. We’d say it was “easy” or perhaps “very easy” (that seldom happened back then). We might also say it was “moderate” or “hard,” or perhaps “very hard” (more likely.) That’s not a very accurate description of intensity by today’s standards, but, of course, that’s all we had. The coach even prescribed the workout using the same terminology – “I want you to run moderately hard today.” That usually meant we had to try to keep up with the fastest runner on the team who was running “moderately hard.” Afterwards, we’d compare notes on how hard it really was. Other than a few sandbaggers who always said a hard run was “easy,” everyone pretty much knew what it was really like. Training diaries back then were brief and to the point – “a moderately hard run today.”

Then in 1969 Seiko, a Japanese watch maker, developed a wristwatch with a built-in stopwatch (Neil Armstrong wore it on the moon that same year). Casio came out with theirs shortly after. I was out of college by then, but I can recall the excitement of having precise times available on my wrist. This was the height of technology! It couldn’t get any better than this! But remarkably, it did.
In 1978 Polar, a Finnish company, produced a wearable heart rate monitor that doubled as a wristwatch. Amazing! I got my first one in 1981. Up until then we would stop occasionally and count heartbeats at the throat for 10 seconds and compare ours with a running mate’s. This raised more questions than answers. We were running the same pace, so “why are our heart rates not the same?” we wondered. That resulted in some head scratching.
The answer to that question led me within a year to come up with heart rate “training zones” for the athletes I was now coaching. I required them all to have heart rate monitors, which were about the size of small fax machines back then. The zones were based on my experiences and the data I gathered from my athletes from workouts and testing. The 1987 book, Training, Lactate, Pulserate, by Peter G.J.M. Janssen also played a role in what I came up with.
Now we were at the pinnacle of training technology – or so I thought.
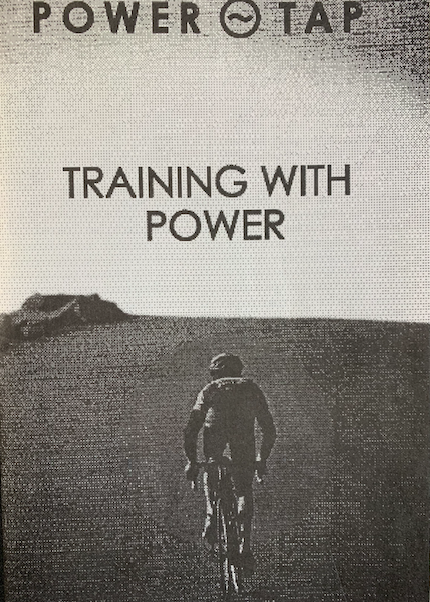
Then, in 1986, the portable bike power meter was invented by SRM, a German company founded by engineer/cyclist Uli Schoberer. I got my first SRM in 1995 (actually, Uli loaned it to me as I couldn’t afford it on a coaching salary). Again, my world as a coach was turned upside down. I now had to come up with “zones” for power. The first zone system I developed fell through after I wrote a 32-page booklet called Training With Power. I eventually came to realize that I didn’t like that scale so abandoned it in the early 2000s. This was about the time than Andy Coggan, PhD developed a power zone system. I adopted his. And now I also required my clients to have power meters in addition to their heart rate monitors.

As I’m sure you know, that wasn’t the end of intensity-measuring devices for endurance sports. We are now practically overwhelmed with technology. We’ve come a long way since the stopwatch. And I’ve about quit trying to keep up with everything now available – and how we express the data relative to training intensity. Hence, the chart I was working on this week for my next book and my outreach to Andy Kirkland.
I asked Andy to take a look at the chart because he had written an article some time back on the need to simplify how we express intensity as coaches. Besides being a sport scientist, he is also a coach and an athlete. And even better, he doesn’t pull any punches. I trust his opinions and I know he’ll tell me what he thinks. The chart seemed simple from my convoluted viewpoint: 10 rows and 10 columns. Each column was intended for a different type of athlete from beginner to well-experienced and examples of language that could be used to talk about intensity. The rows were the zones. That seemed straight forward to me.
Andy disagreed. In a nice sort of way, he told me that it was too complex. Surprise, surprise! He sent me the system he uses in coaching triathletes. There were four data points based on how long the athlete could hold the effort in their sport given their experience. That is certainly simple. Now what? I’m back to the drawing board to come up with a system that summarizes the intensity of training. While I agree with Andy’s push to Keep It Simple, Stupid, it comes across as overly simple to me. Perhaps that’s a good thing. I need to think some more about it. I’ll let you know what comes of this.

You must be logged in to post a comment.